EconometricsNowWorld

EconometricsNowWorld


$1.99

6.5.0for iPhone, iPad and more
9.9
2 Ratings
Victor Hidalgo
Developer
6 MB
Size
Dec 29, 2020
Update Date
Education
Category
4+
Age Rating
Age Rating
4+
Apps in this category do not contain restricted content.
9+
Apps in this category may contain mild or occasional cartoon, fantasy or real-life violence, as well as occasional or mild adult, sexually suggestive or horrifying content and may not be suitable for children under 9 years of age.
12+
Apps in this category may contain occasional mild indecent language, frequent or intense cartoon or real-life violence, minor or occasional adult or sexually suggestive material, and simulated gambling, and may be for children under 12 years of age.
17+
You must be at least 17 years old to access this App.
Apps in this category may contain frequent and intense offensive language; Frequent and intense cartoon, fantasy or realistic violence: frequent and intense adult, scary and sexually suggestive subjects: as well as sexual content, nudity, tobacco, alcohol and drugs, may not be suitable for children under 17 years of age.
EconometricsNowWorld Screenshots
EconometricsNowWorld posterEconometricsNowWorld posterEconometricsNowWorld posterEconometricsNowWorld posterEconometricsNowWorld posterEconometricsNowWorld posterEconometricsNowWorld posterEconometricsNowWorld poster

About EconometricsNowWorld

Make statistical calculations in the general linear model or set the mean, median and mode for the data analysis you are performing in your project or study.

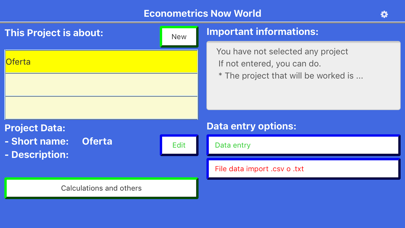
The application is managed through activation by color. The options marked with green are ready for use, and those marked with red require a preliminary step to be active. The options marked with color other than green and red are normally used and are not critical.

Fields containing relevant information will be able to indicate what is necessary to activate a particular option or show information.

Each calculation project may have 15 variables and 1000 data, at the most, for each. Additionally, there are 15 fields that may be used to include the remnants of a model, if necessary.

Data entry may be carried out through the use of a keyboard or by import. Data import (name of variables and data for each case) may be used provided that there is no data entered into the project, and may be done in CSV and TXT file formats. The import requires previously granted permits for information storage services. The most commonly used separators are recognized in data import; however, their change may be requested if they have not been established as commonly used separators.

Calculation Options -

Statistics - It allows the display of basic statistics, as well as the behavior of selected variables on a chart.

General Linear Model - Assisted by the use of green and red colors, it will allow selecting the endogenous and exogenous variable of the model, as well its remnants, if applicable. Once the calculation option has been enabled, it shall be chosen to set the model data calculation and records.

It includes the option to record data resulting from a model for inclusion in another one, if necessary. The name with which the variable will be included and edited in data entry options shall be specified.

If required, the data produced and extracted from the model may be copied to a spreadsheet, provided that you tap a cell, click it and simply choose the option “Select All”, and then do the reverse process (copy) in the spreadsheet you have.

Charts may be enabled and, by default, the residual chart is always shown in XY Scatter Charts format. To disable variables in this option you must click one of the active variables listed in the chart Menu and include the one you want.

The confidence level of the Student’s t-distribution may vary, while F-distribution will remain at 95%.

Frequency Table (Discrete Data) - It is recommended, as stated in theory, that this option should be for a maximum of 12 levels. For more data, the use of Grouped Frequency Distribution is recommended.

Any calculation is performed by including the study variable.
The possibility to use frequency polygons with the corresponding histogram is shown in charts.

Grouped Frequency Distribution - The same opportunities as in the case of the Frequency Table (Discrete Data) are presented, except that the number of intervals to have is further required.
The number of intervals is suggested, if possible.

Distribution Table Query - It allows the display of Standard Normal, Student’s t, Chi-square and F-distribution tables. For ease of data reading you may click inside the table and the top and left ends will be marked and highlighted for a quick search.
Show More

What's New in the Latest Version 6.5.0

Last updated on Dec 29, 2020
Old Versions
Privacy policy - explicit
Show More
Version History
6.5.0
Dec 29, 2020
Privacy policy - explicit
6.0.0
Oct 5, 2020
Correction of errors in the titles. Other improvements.
5.5.0
Oct 30, 2019
Improved response times and an unnecessary movement on the home screen was eliminated.
4.0.0
Oct 6, 2018
Errors have been corrected and improvements have been made in data entry and incorporated more statistical calculations.

In the gear, incorporates the possibility of language change from Spanish to English or vice versa.

For the entry of data, the disposition of the information has been improved and some keyboards have been incorporated. Thus, the improvements made are in:
- In the entry of new projects,
- Edit the description
- Cancellation of projects
- Input of variables and numerical data of the same.
- That it is enough to click on the "Projects" screen so that it will slide over the information in case it is larger than the available screen.
- Others

In the general linear model:
- Improvement of the choice of variables and their lags.
- Control of initial rows in case they do not contain data or are zero
- Control of operations that include logarithms for elasticities.
- Others

In the table of discrete data frequencies and in the table of frequencies of grouped data we have:
- Total redesign
- Considers independent keyboards according to the information entry needs
- Consider the formulas that are used, if that option is indicated.
- The frequency tables show in each case the summations or the number of data required for the calculation.
- The design of the graphics have been improved, with the consideration of the incorporation of more data in them.
- Others

General calculations:
- In the option "Statistics" the general calculations are worked.
- In discrete data frequency tables, the specific calculations have been incorporated, as the case may be.
- In tables of frequencies of grouped data the specific calculations have been incorporated, as the case may be.
- In the calculations with frequency tables, data has been included in the graphs.
- Others
3.5.0
May 11, 2018
In this update we have included iPhone compatibility and small design improvements.
Possibility of working in Spanish or English.
1.5
Sep 1, 2016
Minor bug fixes and adding language. Now in English and Spanish.
1.0
Aug 4, 2016

EconometricsNowWorld FAQ

Click here to learn how to download EconometricsNowWorld in restricted country or region.
Check the following list to see the minimum requirements of EconometricsNowWorld.
iPhone
Requires iOS 11.0 or later.
iPad
Requires iPadOS 11.0 or later.
iPod touch
Requires iOS 11.0 or later.
EconometricsNowWorld supports English

EconometricsNowWorld Alternative

You May Also Like

Get more from Victor Hidalgo