In probability theory and statistics, the geometric distribution is either of two discrete probability distributions: (1) The probability distribution of the number x of Bernoulli trials needed to get one success or (2) The probability distribution of the number y = x − 1 of failures before the first success,
•
A random variable (x) which can assume of two values (0,1) is said to have a Bernoulli Distribution if there is a constant p: 0 greater p less 1, such that Pr[ x = 0 ] = 1 - p.
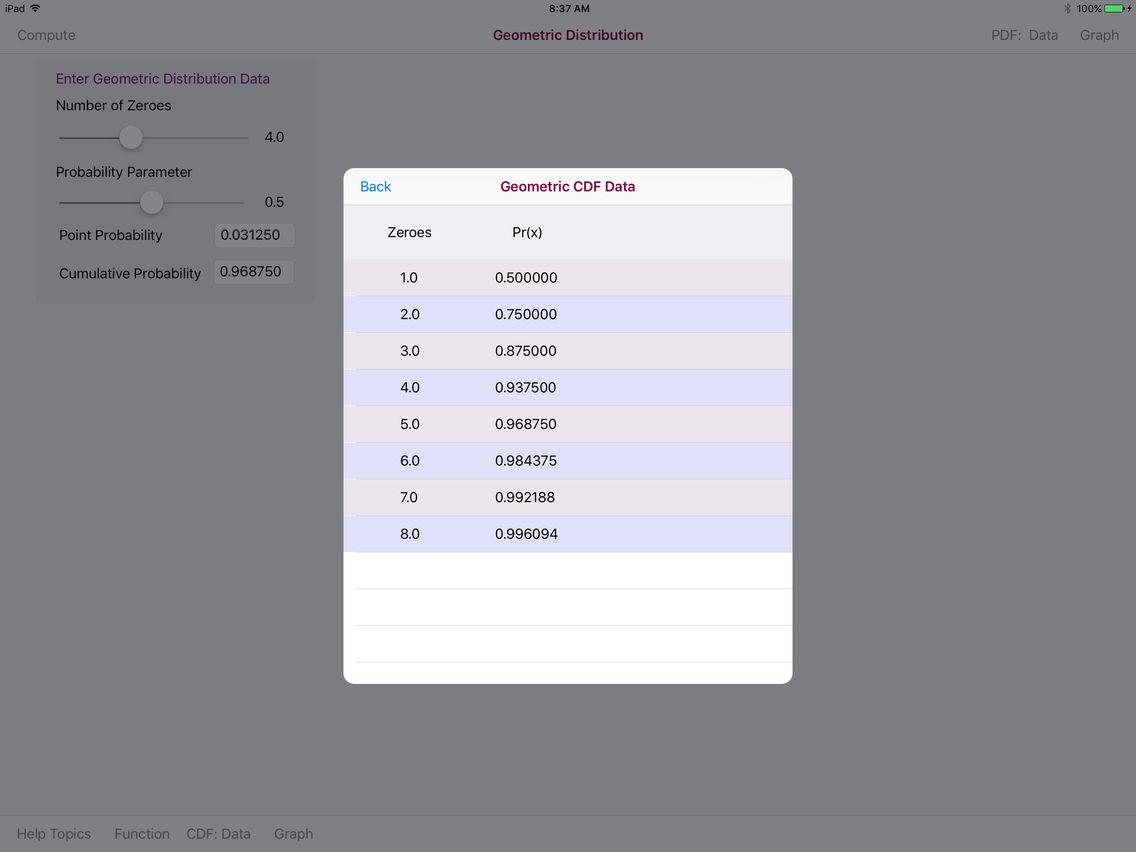
The Geometric Distribution app provides for the data entry of two variables: Number of Zeroes and a Probability Parameter. The range for the Number of Zeroes variable is 1.0 - 8.0 and the range of the Probability Parameter is 0.01 - 0.99.
The Geometric Distribution app produces a PDF/CDF Graph and PDF/CDF Data Tables The Number of Zeroes and Probability Parameter variables selected are used to compute the PDF/CDF data.
The PDF and CDF graphs are touch interactive graphs for computed (x/Pr(x) paired values. The graphs hav a touch feature whereby upon the touch a slidable vertical line appears. Upon movement of the line a paired (x,Pr(x) values appear relative to the line position on the graph curve.
The horizontal x-axis displays computed (x) values. The vertical y-axis plots a range of Pr(X) values.