This release includes security enhancements and general bug fixes.
• This release introduces several performance and interface enhancements
• This release has fixed daily weather forecast text so that all weather parameter units are consistent with user selected unit types.
• This release is addressing time zone inconsistencies found on select weather parameters.
• Environmental Intelligence Suite users with the Aviation Add-on will now have access to the Risk Outlook table they are used to in the web experience now available on the Mobile application.
• Support was added for IBM Outage Prediction customers allowing the visualization of outage forecasts over their service territory regions.
This update reflects a change to our authentication experience. NOTE: All users must update their App to this new version by 10/31/21 to ensure uninterrupted service
• The colors and icons used to classify alert conditions have been updated to be more intuitive
• We’ve updated our Strom Tracks overlay functionality within your Dashboard Maps to more closely match your experience on the web version.
• We’ve updated our Strom Tracks overlay functionality within your Dashboard Maps. In addition to improved functionality, we have added additional detail available within a pop-up when you select an individual storm cell.
• We’ve added a Find Me button on the interactive map, allowing you to locate your position on the map (How close is that storm to me?)
• For our Vegetation Management Customers, we’ve added the ability to view your service area, and vegetation impacts in the map view.
This released enhances our alert processing, and management for our users.
Improvements include:
• We’ve added several new overlays: Severe Outlooks, Tropical Tracks, Tropical Model Tracks, Pressure Contours, Local Storm Reports, Earthquakes, and Fronts
• Layer details have been exposed for query over map for the majority of available map layers
• Additional Popup Information for several available overlays
We’ve addressed a phrasing issue in one of our Alert Panels to help improve understanding by our users.
We’ve added support for usage analytics to help our teams track most popular features within the application.
Improvements include:
• For Agriculture users, we have added Field boundaries.
• We have made Visual updates to incorporate a consistent style guide across our products
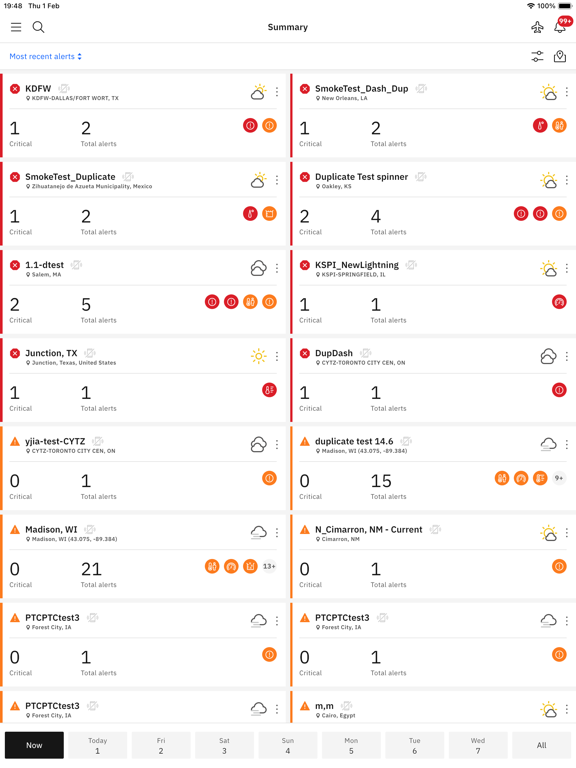
• Added full screen map to our Summary View, showing all dashboard locations and status.
Improvements include:
• Adjusted font colors for weather station plots to improve readability.
Improvements include:
• The addition of a Timeline Control on the Summary Page
• New graphs for Agriculture customers: Inversion Risk, Soil Moisture, Soil Temperature, UV Index, Crop/Reference ET, GDD Daily
• Lightning Type Options on Interactive Map for Aviation customers (Cloud to Cloud / Cloud to Ground)
• Delete Dashboard feature
• Show Legend Detail (For Temperature Layer only)
Improvements include:
• The ability to duplicate a dashboard for another location
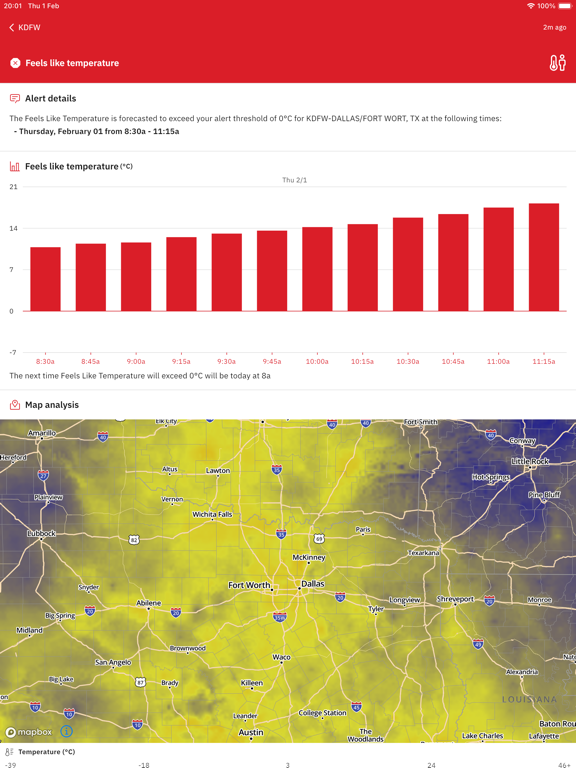
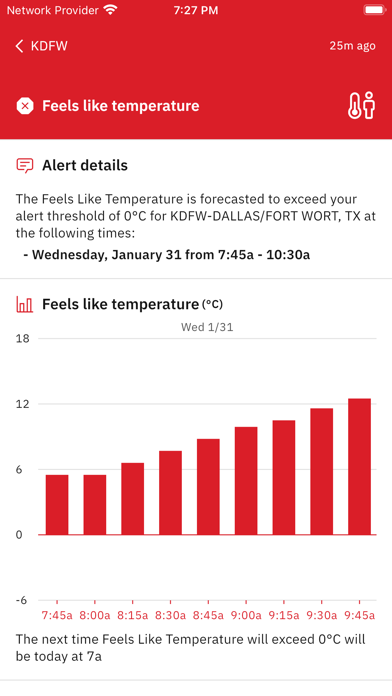
• The addition for Probabilistic Forecast information on alert detail pages
• Map improvements to add Road Weather and Traffic overlays, and the ability to tap-and-hold on a map to retrieve location details.
• The ability to manage National Weather Service Alerts
• The Addition of TAF data for Aviation customers
1.6.2 Release provides no additional functionality. This release simply updates some back-end data sourcing.
This release contains assorted bug fixes
Improvements include:
• Edit Dashboard – Users may now edit the dashboard to rename it, to set to active or inactive status, or to assign/remove user access
• Improved Charting – All forecast panel bar charts have been updated to provide improved visualization along with improved performance.
Agriculture Improvements include:
• Disease Recognition – Users subscribed to the agricultural version can now use the Disease recognition tool to capture and analyze a photo of their corn crop for several common diseases.
• Improved Field Details – Field Details have been enhanced to include additional information such as a listing of the currently available field-level analytics.
Agriculture Improvements include:
• Forecast Crop Yield Layer – Users subscribed to the agricultural version can now view forecast crop yield on the interactive map. Yield forecasts are available throughout the growing season (select crops and geographies)
• Seasonal Outlooks layer – Within the interactive map you can display our global seasonal and sub-seasonal forecasts, with temperature and precipitation predictions from 3-4 weeks (sub-seasonal) to monthly and quarterly out to seven months.
• Optimized Legends for Crop Yield and Crop Health Layers – Our new Optimized legends provide more differentiation in color and detail when the data range is narrow. This helps you to better visualize variations in health and yield forecast within your field.
Standard Improvements include:
· Global Search – easily find the dashboard you are looking for. Magnifying glass in Upper left launches search. As you type in characters, potential matches will appear. Click to go directly to that dashboard.
· Map Improvements – more layers and overlays have been added, and the Map Settings menu now contains filters to help you quickly locate the weather features you are looking for. Some features contain additional options and theses choices now display for your selection when you select the feature.
· Dashboard Information – An “info” icon has been added next to each dashboard name, allowing you to tap to see the exact location the dashboard is configured for.
Agriculture Improvements include:
· Field Level Display – Each Field Dashboard will display field boundaries (at closer zoom levels) for your fields.
· Electronic Field Records (EFR) – can be accessed by tapping the info icon next to the field name. The EFR displays crop type, acreage, and planting date.
· Field Level Analytics – Within your field boundaries you can view analytics such as Soil Temp, Soill Moisture, Crop Health (NDVI, EVI, and cloud masked versions). Optimized and standard legends now exist for the Crop health data.
· AG Forecast Table – Added to the Forecast tab in addition to Hourly and Daily is a new Ag Forecast option, providing planting and growing relevant forecast data.