WarmingStripes

WarmingStripes


Free

1.1.0for iPhone
Ralf Andrae
Developer
2019年11月27日
Update Date
Education
Category
Age Rating
4+
Apps in this category do not contain restricted content.
9+
Apps in this category may contain mild or occasional cartoon, fantasy or real-life violence, as well as occasional or mild adult, sexually suggestive or horrifying content and may not be suitable for children under 9 years of age.
12+
Apps in this category may contain occasional mild indecent language, frequent or intense cartoon or real-life violence, minor or occasional adult or sexually suggestive material, and simulated gambling, and may be for children under 12 years of age.
17+
You must be at least 17 years old to access this App.
Apps in this category may contain frequent and intense offensive language; Frequent and intense cartoon, fantasy or realistic violence: frequent and intense adult, scary and sexually suggestive subjects: as well as sexual content, nudity, tobacco, alcohol and drugs, may not be suitable for children under 17 years of age.
WarmingStripes 螢幕截圖
WarmingStripes 海報WarmingStripes 海報WarmingStripes 海報WarmingStripes 海報WarmingStripes 海報WarmingStripes 海報WarmingStripes 海報WarmingStripes 海報

About WarmingStripes

Warming Stripes visualizes our warming world. The trend is unmistakable.

Maybe you have noticed pictures with these blue and red stripes in social media channels like twitter or Facebook lately.
Beyond being a pretty cool looking on its own, this images tells an important story:

Climate scientist Ed Hawkins created the blue to red images to visualize the warming our planet has been going through. While there are many sources of information that provide more specific details on how temperatures have changed, these graphics were intentionally designed to be as simple as possible to spark conversations about our warming world and the effects of climate change.

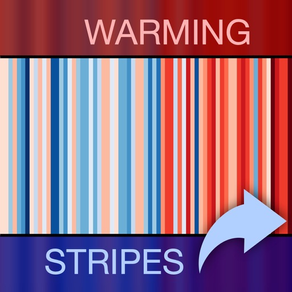
The ‘warming stripe’ graphics are visual representations of the change in temperature as measured in each country over the past 100+ years. Each stripe represents the temperature in that country averaged over a year. For most countries, the stripes start in the year 1901 and finish in 2018.

For virtually every country or region, the stripes turn from mainly blue to mainly red in more recent years, illustrating the rise in average temperatures in that country.

With the app "WarmingStripes" you can create these graphics for your region, combine them with your avatar or other information and share them with a few clicks on Twitter, Facebook, Instagram etc.

Further information is also available at
- https://showyourstripes.info
- https://www.climate-lab-book.ac.uk/author/ehawkins/
- https://www.climate-lab-book.ac.uk/2018/warming-stripes/
Show More

最新版本1.1.0更新日誌

Last updated on 2019年11月27日
歷史版本
- Fixed a bug in the database of global CO2 values (Mauna Loa Observatory Data)
- Minor iOS 13 adjustments
Show More
Version History
1.1.0
2019年11月27日
- Fixed a bug in the database of global CO2 values (Mauna Loa Observatory Data)
- Minor iOS 13 adjustments

WarmingStripes FAQ

點擊此處瞭解如何在受限國家或地區下載WarmingStripes。
以下為WarmingStripes的最低配置要求。
iPhone
WarmingStripes支持English

WarmingStripes相關應用

你可能還喜歡

Ralf Andrae 開發者的更多應用