Graph

Graph


Gratis

12.16.1for Mac
VVI
Developer
15 MB
Size
20/04/2024
Update Date
Productivity
Category
4+
Age Rating
Age Rating
4+
Apps in this category do not contain restricted content.
9+
Apps in this category may contain mild or occasional cartoon, fantasy or real-life violence, as well as occasional or mild adult, sexually suggestive or horrifying content and may not be suitable for children under 9 years of age.
12+
Apps in this category may contain occasional mild indecent language, frequent or intense cartoon or real-life violence, minor or occasional adult or sexually suggestive material, and simulated gambling, and may be for children under 12 years of age.
17+
You must be at least 17 years old to access this App.
Apps in this category may contain frequent and intense offensive language; Frequent and intense cartoon, fantasy or realistic violence: frequent and intense adult, scary and sexually suggestive subjects: as well as sexual content, nudity, tobacco, alcohol and drugs, may not be suitable for children under 17 years of age.
لقطات الشاشة لـ Graph
Graph الملصقGraph الملصقGraph الملصقGraph الملصقGraph الملصقGraph الملصق

About Graph

Graph: "You give it data and it gives you a graph." Other things are straightforward, unobtrusive and automatic. People using Graph have this to say about it:

"The fact that the Graph app for the Mac is free is nothing short of remarkable because charts and graphs are instant. Drop in some numbers and the graph practically builds itself."

"A great program. Don't let the first screen shot fool you, the output available is actually very impressive."

"More features are available in the not-so-free Graph versions, Graph IDE, which extends graphs far beyond Graph, and, frankly, far beyond Excel graphs."

Graph should give you a similar experience. Graph for iPhone, iPad and Mac has been downloaded over one million times and it is best to ensure that the Graph user interface is working for each and every one of those downloads. So, on the off chance that you encounter difficulty then please email support@vvi.com to get in touch with an expert.


FEATURES

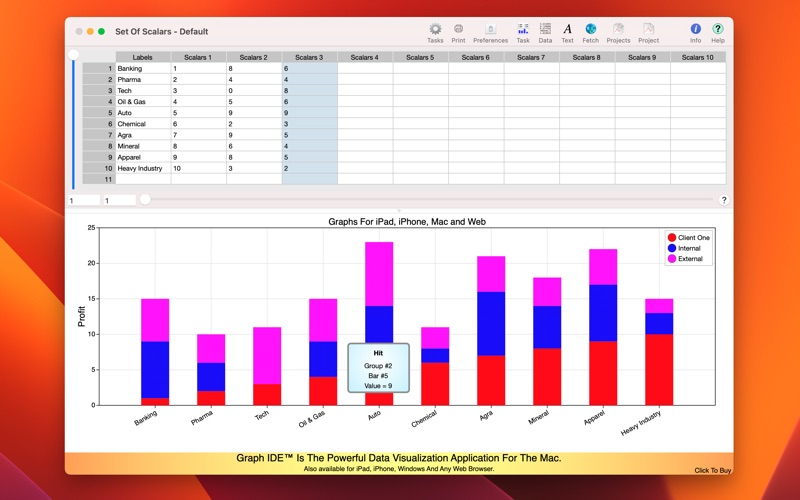
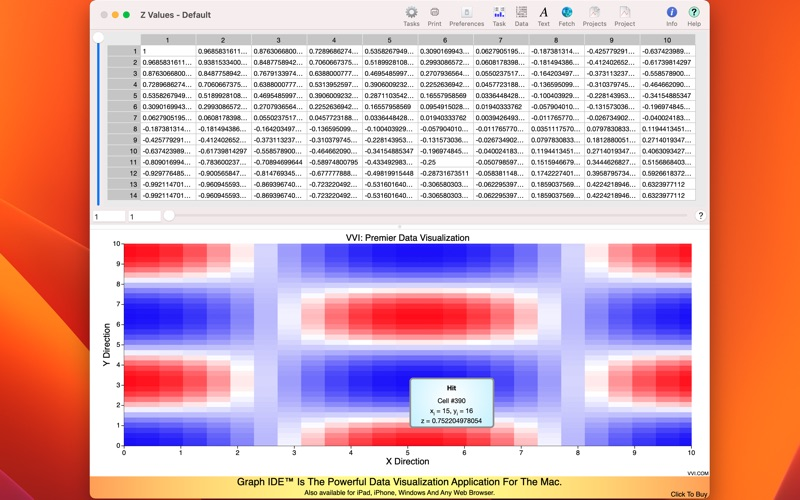
• Includes several 1D, 2D and 3D graph types such as bar, column, pie, line, area, scatter, 3D perspective scatter, trajectory and surface, volumetric, z-sliced cell, maps, linear, semi-log, x-log, log-log, polar, r-log, Gregorian date and many variations.
• Data is pasted from the pasteboard, fetched from web servers or the file system and inserted and edited using a table interface.
• Click-drag graphs to rotate and scan data.
• Click and hover over data to edit and show their values.
• Includes an integrated manual.
• Explore data sets directly from the graph or in numeric format from the table.
• Projects are navigated using a simple tool sheet.
• Thousands of graphic, graph and data attributes, including artwork, maps, autoscaling and many effects can be set by applying a skin made with Graph IDE (a separate application).
• Data and preferences are organized by project and each project is persistent and automatically saved so you can show and retrieve your settings and data on subsequent use.
Show More

تحديث لأحدث إصدار 12.16.1

Last updated on 20/04/2024
الإصدارات القديمة
This version is faster and more secure. That is accomplished by pre-caching hashes and other deterministic values into the signed binaries. That means that the user interface is 2-4 times faster and common operations are much more immune to injection attempts or system changes. Being fast and secure translates into robust and dependable data visualization. The off-board control panels (selectors) have also been optimized for much better placement on the screen and performance in general. All state duplication is now much faster and more reliable. Transient tooltips are also many times faster. Menus are also many times faster. Tables are also much faster. A faster user interface (UI) translates into faster data visualization (DV) because DV and UI computations compete for resources. Reliable and secure means more immune to system changes and unaccounted for injection such as during operating system updating, hacking or changes in system API. Thousands of code points were also replaced with more secure implementations and the theoretically unsecured (and slower) code API is now removed.
Show More
Version History
12.16.1
20/04/2024
This version is faster and more secure. That is accomplished by pre-caching hashes and other deterministic values into the signed binaries. That means that the user interface is 2-4 times faster and common operations are much more immune to injection attempts or system changes. Being fast and secure translates into robust and dependable data visualization. The off-board control panels (selectors) have also been optimized for much better placement on the screen and performance in general. All state duplication is now much faster and more reliable. Transient tooltips are also many times faster. Menus are also many times faster. Tables are also much faster. A faster user interface (UI) translates into faster data visualization (DV) because DV and UI computations compete for resources. Reliable and secure means more immune to system changes and unaccounted for injection such as during operating system updating, hacking or changes in system API. Thousands of code points were also replaced with more secure implementations and the theoretically unsecured (and slower) code API is now removed.

Graph FAQ

انقر هنا لمعرفة كيفية تنزيل Graph في بلد أو منطقة محظورة.
تحقق من القائمة التالية لمعرفة الحد الأدنى من المتطلبات Graph.
Mac
Requiere macOS 10.11 o posterior.

بدائل لـ Graph

ربما يعجبك أيضا

أكثر البرنامج من VVI